Purchase Items Summary Report
The Purchase Items Summary Report in O2VEND Back Office provides a complete breakdown of all purchased products within the selected date range.
The report assists in inventory cost analysis, supplier evaluation, and purchase planning by displaying quantities, discounts, returns, and financial totals in a structured format.
Purpose of the Report
The report highlights:
- Total items purchased within a specific period
- Category, brand, and SKU-level purchase distribution
- Discount applications and adjusted final amounts
- Return quantities and return value adjustments
- Branch-wise purchase comparison
- Payment method summary for purchases
This information supports procurement control, inventory planning, and financial accuracy.
Navigation Path
- Open Back Office.
- Go to Reports.
- Select Purchase Reports.
- Click Purchase Items Summary to load the report.
- Apply Date Range and Branch filters as required.
Filters and Options
Date Range
Displays purchases recorded between the selected start and end dates.
Branch Selection
A dedicated Branch filter supports consolidated or individual branch analysis, beneficial for multi-location operations.
Search & Filter Options
The report includes:
- Category filter
- Brand filter
- Product name search
- SKU search
- GTIN search
These tools allow in-depth filtering and quick access to specific data.
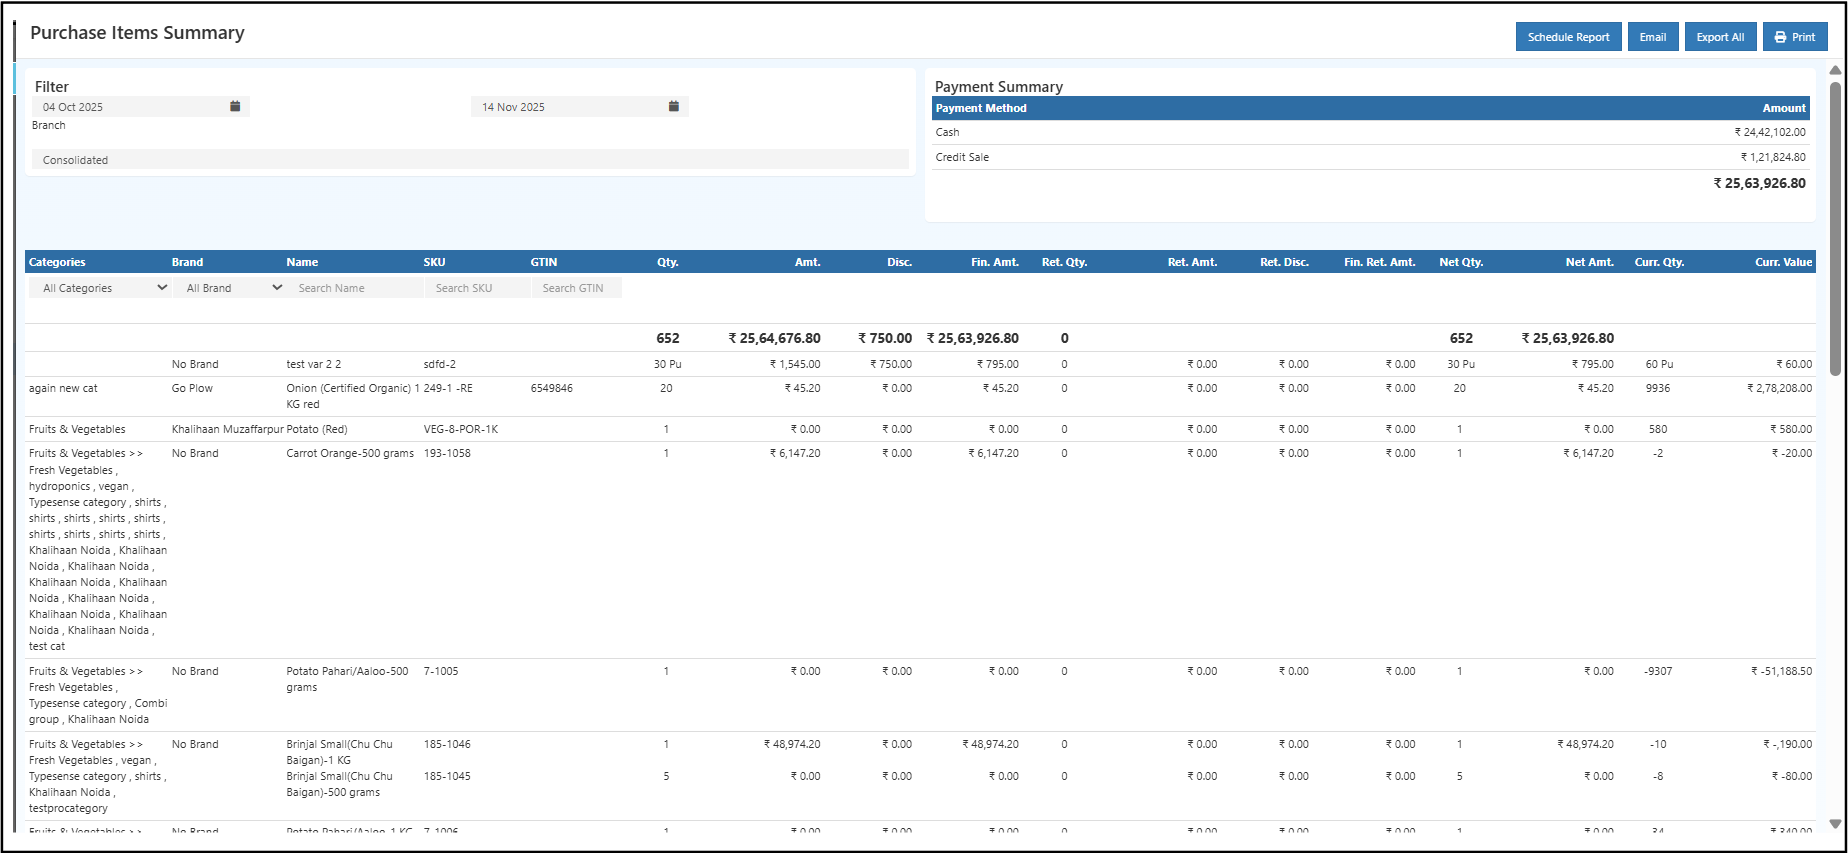
Payment Summary Section
A payment overview appears at the top-right of the report, showing:
- Payment Method — Cash, Credit Purchase, Online, etc.
- Amount — Total value for each method
This snapshot assists in understanding payment distribution across suppliers.
Report Table Columns
The table provides a detailed view of each purchased item.
| Column | Description |
|---|---|
| Categories | Product category |
| Brand | Brand of the item |
| Name | Product name or variation |
| SKU | Unique product identifier |
| GTIN | Barcode / global identification number |
| Qty. | Total purchased quantity |
| Amt. | Purchase amount before discount |
| Disc. | Discount applied during purchase |
| Fin. Amt. | Amount after discount |
| Ret. Qty. | Returned quantity |
| Ret. Amt. | Value of returned quantity |
| Ret. Disc. | Discount reversal relating to returns |
| Fin. Ret. Amt. | Final return value |
| Net Qty. | Purchased quantity minus returns |
| Net Amt. | Final net amount |
| Curr. Qty. | Current stock quantity available |
| Curr. Value | Valuation of current stock |
This structured data helps track item performance, vendor behavior, and cost distribution.
Insights from the Report
The report answers key business questions such as:
- Which items had the highest purchase volume?
- Which brands or suppliers contribute the most to procurement?
- Which items have high return rates?
- Which categories account for the most stock value?
- How much was purchased via cash or credit?
- How much stock remains and what is its value?
These insights support smart purchasing, stock control, and negotiation with vendors.
Export & Print Options
The report includes:
- Export All → Download as CSV
- Email → Send report directly from the system
- Print → Print-ready format
- Schedule Report → Automated scheduled delivery
These features make reporting easy for purchase teams, accounts, and management.
Benefits of the Purchase Items Summary Report
- Clear visibility into procurement patterns
- Helpful for forecasting and reorder planning
- Accurate tracking of returns and discount adjustments
- Complete branch-wise comparison
- Strong financial control with net and final amounts
- Supports inventory valuation and costing decisions