Supplier Report – O2VEND ERP Tutorial
The Supplier Report brings together everything you need to evaluate your suppliers and manage inventory effectively. Once you start using it consistently, decision-making becomes faster, more accurate, and backed by real data.
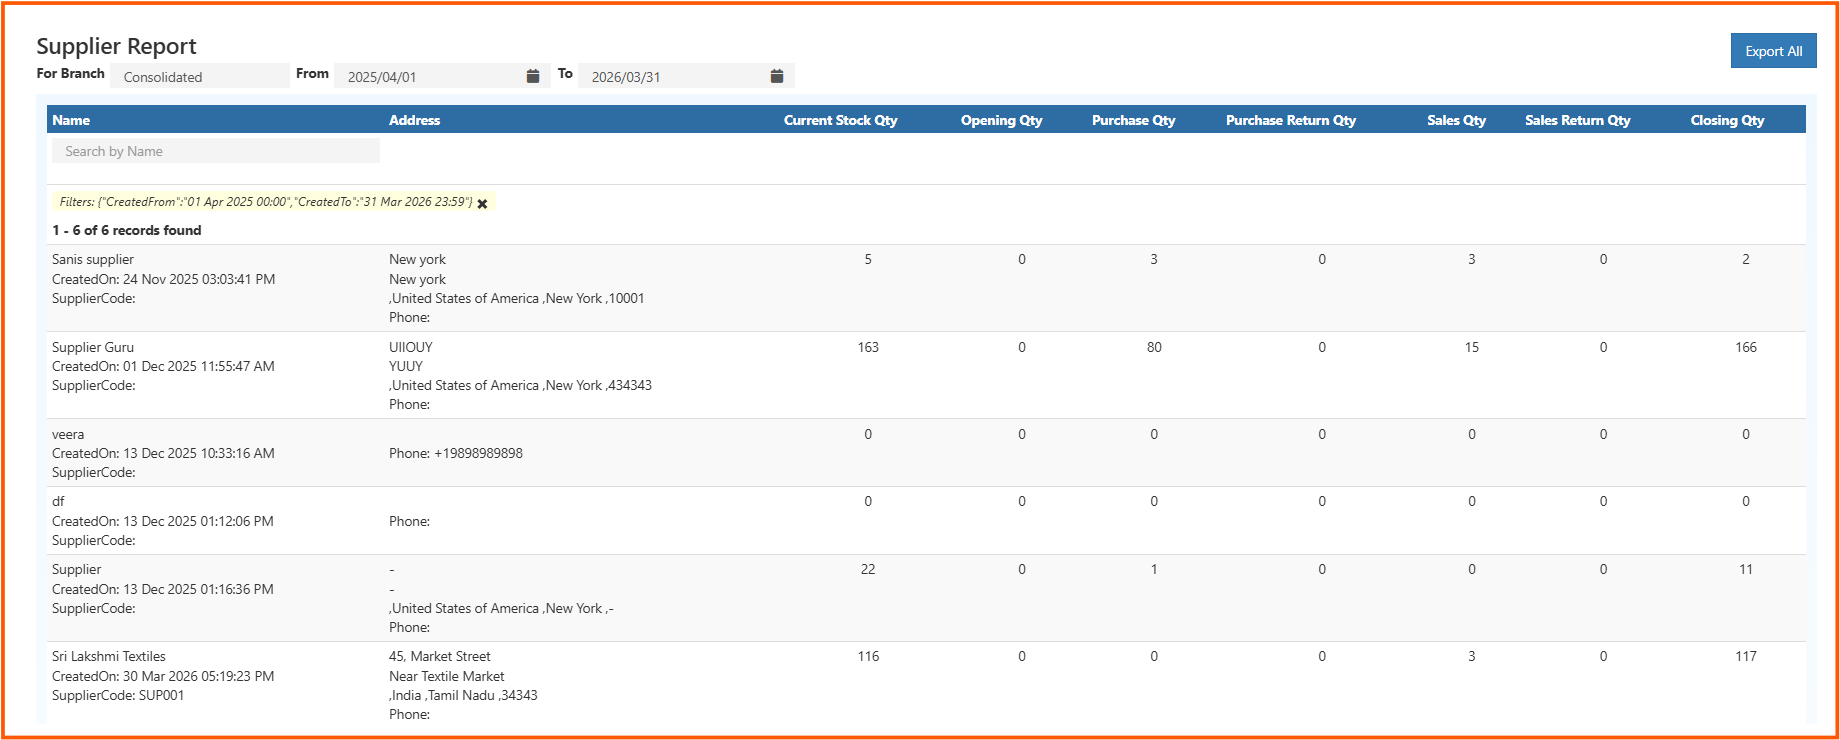
A complete view of stock movement per supplier — purchases, returns, sales, and closing balance, all in one place.
What Is the Supplier Report?
The Supplier Report in O2VEND ERP gives you a full picture of how inventory moves with each supplier. Instead of jumping between multiple reports, everything is combined in one place — making it easier to understand what's really happening with your stock.
It covers the full journey of products: Opening Stock → Purchases → Returns → Sales → Closing Balance
Navigation
O2VEND Back office -> Reports -> Supplier Reports
Purpose of the Report
The main goal is to track how much stock is coming in, going out, and how each supplier is contributing to that flow.
With this report, teams can:
- Keep an eye on stock levels
- Understand supplier performance
- Avoid overstocking or shortages
- Cross-check inventory during audits
Understanding Each Column
Opening Qty
Stock available at the beginning of the selected period. This is your baseline for tracking all movement.
Purchase Qty
Total items bought from the supplier during the period. Shows how much you depend on each supplier.
Purchase Return Qty
Items sent back to the supplier — usually due to damage, wrong supply, or quality issues.
Sales Qty
Number of items sold that are linked to that supplier's products.
Sales Return Qty
Products returned by customers. A high number here may hint at quality or satisfaction issues.
Closing Qty
What remains at the end of the period after all purchases, sales, and returns are accounted for.
Filters and Controls
To narrow down the report, three filters are available:
1. Branch Selection Useful if you manage multiple outlets. Pick a specific branch or view consolidated data across all locations.
2. Date Range Set a From and To date to analyze stock movement for any specific period.
3. Supplier Search Quickly find a supplier by name, supplier code, or keyword using the search bar at the top of the table.
How to Read the Report – Practical Insights
Once you start using the report regularly, you'll notice patterns that help with decision-making:
High Purchase, Low Sales Could mean slow-moving stock or over-ordering. Consider reducing future purchase quantities.
High Sales, Low Closing Stock Strong demand — you may need to reorder soon to avoid a stockout.
Frequent Purchase Returns Might point to quality issues with that supplier. Worth reviewing before placing the next order.
Zero Activity Across All Columns The supplier exists in the system but has had no transactions in the selected period. Could be inactive.
Large Gap Between Current Stock and Closing Qty May indicate backdated entries or manual stock corrections — worth investigating.
Export Options
The report can be exported for sharing or record-keeping:
- Excel – for further analysis or editing
- CSV – for importing into other systems
- PDF – for audits or formal reporting
Use the Export All button at the top-right corner of the report screen.
Real-World Use Cases
Procurement Planning
Identify which suppliers need a reorder and which ones are overstocked. Make smarter purchasing decisions.
Supplier Comparison
Compare suppliers side by side based on supply consistency, return rates, and sales contribution.
Inventory Forecasting
Use closing stock and sales trends to predict demand and avoid running out of fast-moving items.
Stock Verification
Match the system's closing quantities against physical stock during periodic audits.
Supply Chain Improvement
Spot problem areas early — excess stock, high return rates, or suppliers with zero activity.