Brand Sales Summary Report
Running a retail business means keeping track of how each brand is performing — not just overall, but month by month. The Brand Sales Summary Report in O2VEND gives you exactly that. It shows a full year's sales breakdown for every brand in your store, all in one place. Whether you want to spot your top-performing brand, find slow months, or track seasonal trends, this report helps you make smarter decisions quickly.
Navigation:
- From the main menu, go to O2VEND Back office ->Reports.
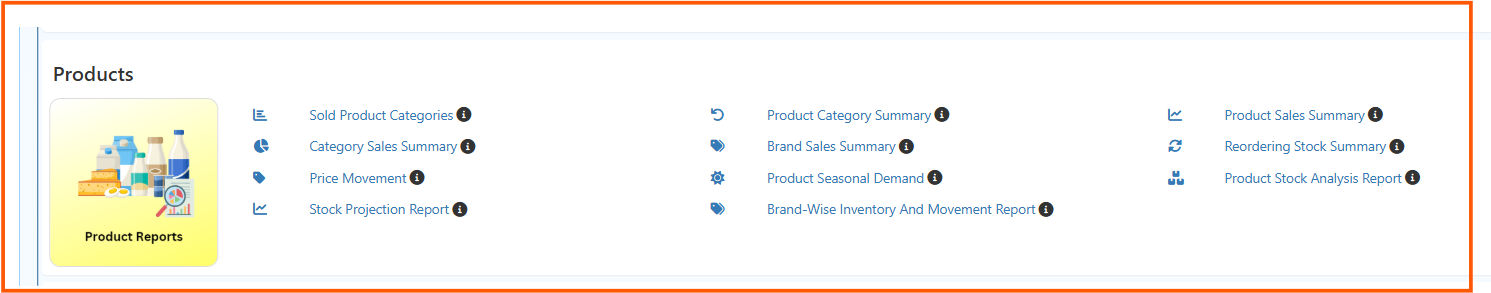
- Under the Products section, you will see a list of product reports
- Click on Brand Sales Summary
Tip: Each report has an ℹ️ info icon next to it. Hover over it to read a quick description before opening.
Step 1: Set Your Filters
When the report opens, you will see filter options at the top. Always set these before reading the data.
| Filter | Description |
|---|---|
| Start Date | Select the beginning of the date range (e.g., 1 Jan 2026) |
| End Date | Select the end of the date range (e.g., 31 Dec 2026) |
| Branch | Choose a specific branch or select Consolidated to view data across all branches |
Setting the date range to a full year (Jan–Dec) gives you a complete picture of how each brand performed throughout the year.
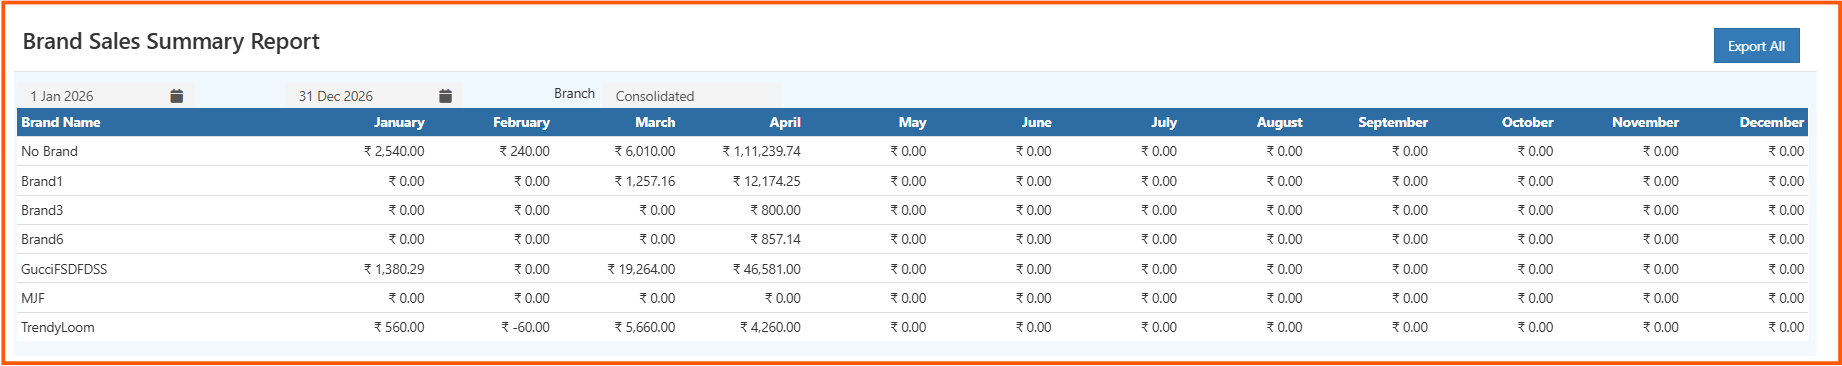
Step 2: Read the Report
The report loads as a table with the following structure:
- Rows → Each row represents one brand (e.g., Brand1, TrendyLoom, MJF)
- Columns → Months from January to December
- Values → Sales amount in ₹ for each brand in that month
Step 3: Export the Report
Once you have reviewed the data, click the Export All button at the top-right corner of the table to download the report as an Excel file.