Sales Item Summary Report
The Sales Item Summary Report in O2VEND gives a complete view of product-level sales along with stock details. It brings together sales, returns, and inventory data into a single screen, making it easier to understand how each product is performing.
Instead of checking separate reports for sales and stock, this report combines everything so you can quickly analyze performance and take action.
How to view the Sales Item Summary Report
- Open Back Office
- Click Reports Section or use shortcut key (Alt+R) the reports section willbe open.
- Click Sales Item Summary to view the report.
- The Sales Item Summary will be shown for the current date.
- Change Start Date and End Date.
- The report will be automatically refreshed with the values for new dates selected.
Tip
Use Export All options to export the report details in to comma seperated CSV file.
How the Report Works
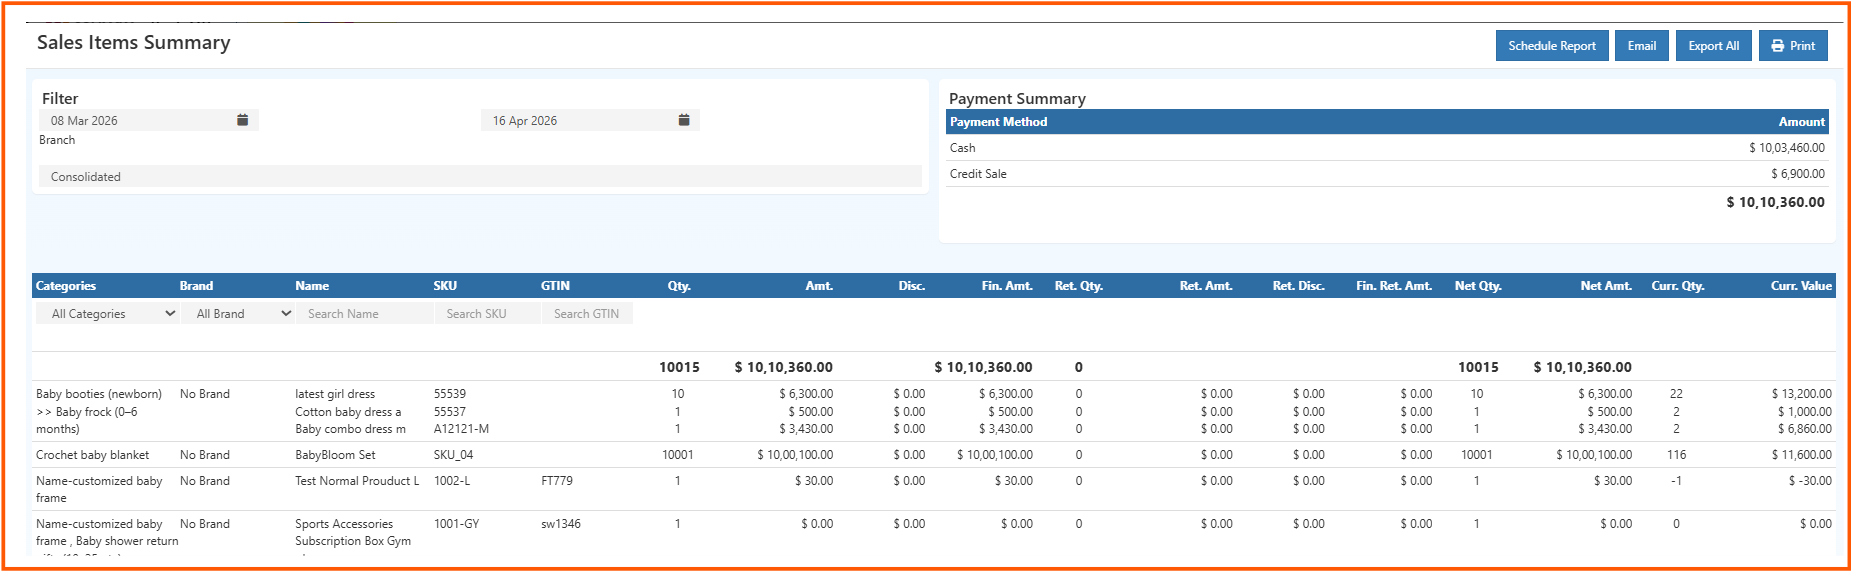
At the top of the report, you’ll find basic filters to control the data:
- Date Range – Select the period you want to analyze
- Branch – Choose consolidated view or a specific branch
Once you update these filters, the report refreshes automatically and shows updated results.
On the right side, there is a Payment Summary section. This gives a quick breakdown of total revenue based on payment methods like cash and credit sales. It helps you quickly understand how payments are being collected.
Report Overview
Each row in the report represents a product, along with detailed information about its sales and stock.
You’ll be able to see:
- Product details like category, brand, name, and SKU
- Quantity sold and total sales amount
- Discounts applied and final sales value
- Return quantities and return amounts
- Net sales quantity and value after returns
- Current stock quantity and stock value
This combination makes it easy to compare sales performance with available inventory.
Filters Inside the Report
To make analysis easier, you can filter data within the report itself:
- Filter by Category
- Filter by Brand
- Search using Product Name, SKU, or GTIN
These filters are useful when working with a large number of products.
Key Actions
At the top right corner, you’ll find important actions:
- Export All – Download the report for offline use
- Print – Generate a printable version
- Email – Share the report instantly
- Schedule Report – Automate report delivery
Schedule Report
You can automate this report to run at regular intervals and send it directly to your email or team.
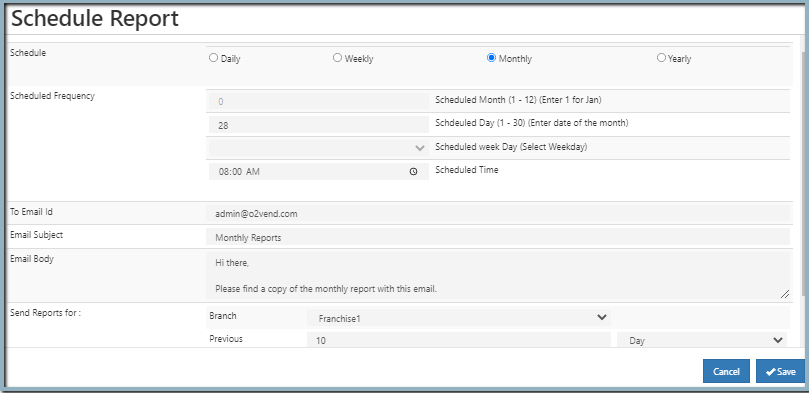
To set it up:
- Select frequency (daily, weekly, monthly, or yearly)
- Choose the time for execution
- Enter email details (recipients, subject, message)
- Select branch and reporting period
- Save the schedule
Once configured, the system will automatically generate and send the report.
Managing Scheduled Reports
After scheduling, all reports can be managed from the profile section.
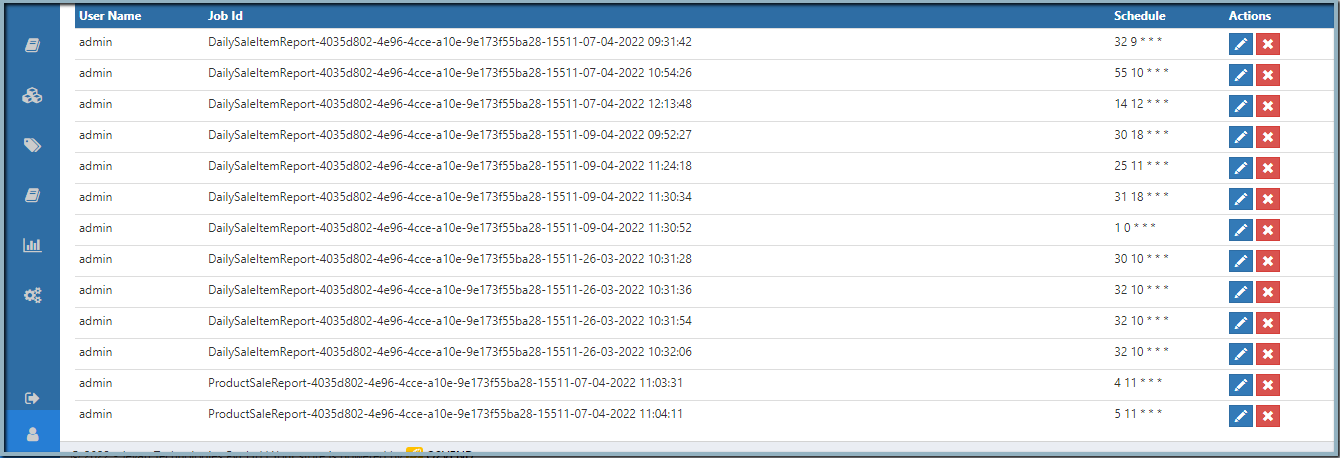
From here, you can:
- View all scheduled reports
- Edit schedules if changes are needed
- Delete reports that are no longer required
Why This Report is Useful
This report helps you make better decisions by answering questions like:
- Which products are selling the most?
- Are there products with high returns?
- Is stock aligned with demand?
- Which items need restocking?
By combining sales and inventory data, it reduces manual work and improves accuracy.
Tip
Use the Export All option regularly to maintain backup records or to share insights with your team.