Supplier Detail Report in O2VEND ERP
Vendor Ledger, Payments & Outstanding Balance
The Supplier Detail Report is the most granular supplier report in O2VEND. It goes beyond totals and gives you product-by-product visibility for a single supplier — covering everything from pricing and cost to full stock movement across the selected period. Use it whenever you need to evaluate a supplier's performance at the product level or trace the journey of specific items.
What Is the Supplier Detail Report?
The Supplier Detail Report in O2VEND ERP gives you a deep, product-level breakdown for a specific supplier. While the Supplier Report shows a summary across all suppliers, this report zooms in on one supplier at a time — showing exactly which products are linked to them, their stock movement, pricing, and purchase history.
It's the right report to use when you want to fully understand a single supplier's contribution to your inventory.
How to Access It
- Log in to the O2VEND Back Office
- Navigate to Reports from the main menu
- Click on Supplier Detail Report
- Select the Supplier you want to view
- Set the Branch and Date Range
- Browse through the Products and Purchases tabs
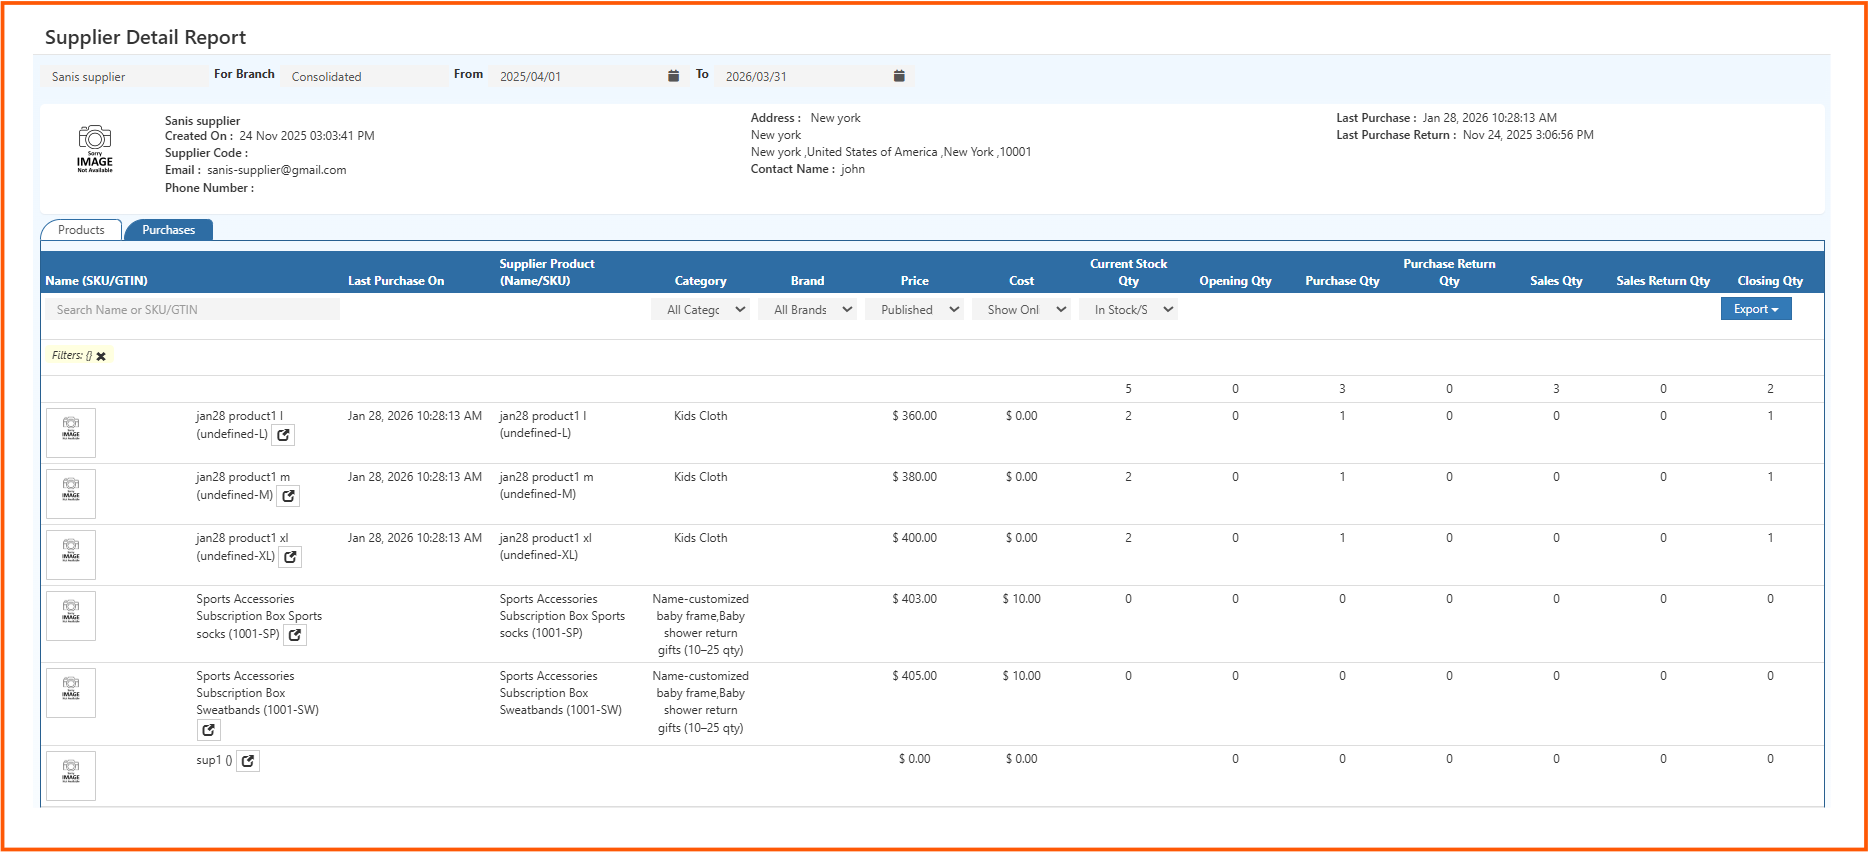
Supplier Profile Section
At the top of the report, you'll see a summary card for the selected supplier. This gives you all the key details at a glance before diving into the data.
| Field | Description |
|---|---|
| Supplier Name | Name of the supplier (e.g., Sanis Supplier) |
| Created On | The date the supplier was added to the system |
| Supplier Code | Unique code assigned to the supplier |
| Supplier's contact email address | |
| Phone Number | Contact number for the supplier |
| Address | Full address including city, state, and country |
| Contact Name | Name of the primary contact person |
| Last Purchase | Date and time of the most recent purchase from this supplier |
| Last Purchase Return | Date and time of the most recent return to this supplier |
Two Tabs: Products and Purchases
The report is split into two tabs, each serving a different purpose.
Products Tab
Shows all the products linked to this supplier along with their stock movement data for the selected period. This is the default view.
Purchases Tab
Shows the purchase transaction history for this supplier — individual orders, quantities, and costs.
Understanding the Products Tab Columns
Name (SKU/GTIN)
The product name along with its SKU or variant identifier (e.g., size like L, M, XL). You can also click the external link icon to open the product directly.
Last Purchase On
The most recent date this specific product was purchased from the supplier.
Supplier Product (Name/SKU)
The supplier's own name or SKU code for the product — useful when your internal name differs from what the supplier calls it.
Category
The product category it belongs to (e.g., Kids Cloth).
Brand
The brand associated with the product.
Price
The selling price of the product in your store.
Cost
The purchase cost of the product from the supplier.
Current Stock Qty
How many units are currently in stock right now.
Opening Qty
Stock available at the start of the selected period.
Purchase Qty
Total units purchased from this supplier during the period.
Purchase Return Qty
Units returned to the supplier during the period.
Sales Qty
Units sold from this supplier's products during the period.
Sales Return Qty
Units returned by customers during the period.
Closing Qty
What remains at the end of the period after all movement is accounted for.
Filters Available
The Products tab comes with several filters to help you narrow down the data:
Search by Name or SKU/GTIN Quickly find a specific product by typing its name or SKU.
All Categories Filter products by their category.
All Brands Filter by brand if the supplier carries multiple brands.
Published Filter by product publish status — Published or Unpublished.
Show Only Choose what type of products to display (e.g., all, specific variants).
In Stock / Out of Stock Filter to see only products that currently have stock, or only those that are out of stock.
Export Export the product data to Excel, CSV, or PDF using the Export button on the top right of the table.
How to Read the Report – Practical Insights
Zero Cost with Active Sales The product has been sold but no purchase cost was recorded. This can affect profit margin calculations — the cost entry may need to be updated.
Current Stock Higher than Closing Qty Additional stock may have been added after the selected period ended, or there could be stock adjustments worth reviewing.
Products with Zero Activity The product is linked to the supplier but had no purchases or sales in the selected period. It may be inactive or discontinued.
Purchase Qty with No Sales Qty Stock came in but nothing was sold. Could indicate slow-moving products that need attention.
Variants Showing Separately Products with size or color variants (like L, M, XL) appear as individual rows. This helps you track stock at the variant level, not just the product level.
Real-World Use Cases
Reviewing a Supplier's Product Portfolio
See the full list of products you've ever purchased from a supplier, along with their current availability and pricing.
Cost vs Price Analysis
Compare the Cost and Price columns to understand margin per product for each supplier.
Variant-Level Stock Tracking
Since each variant (size, color) appears as a separate row, you can identify which variants are in demand and which are sitting idle.
Supplier Performance Review
Check how many products from a supplier have active stock, recent purchases, and consistent sales versus those with zero movement.
Audit and Reconciliation
Use the Opening Qty, Purchase Qty, Sales Qty, and Closing Qty columns together to verify that stock numbers add up correctly.