Stock Movement and Valuation Summary – O2VEND ERP Tutorial
The Stock Movement and Valuation Summary is one of the most comprehensive inventory reports in O2VEND. It tracks both quantity and value across every type of stock movement — giving you full visibility into what happened to your inventory and what it cost during any selected period.
What Is the Stock Movement and Valuation Summary?
The Stock Movement and Valuation Summary in O2VEND combines inventory movement and financial valuation in a single report. For every product, it shows quantity and monetary value across all stock activities — purchases, sales, returns, and dumps — for a selected date range.
It answers two questions at once: how much stock moved? and what was it worth?
How to Access It
- Log in to the O2VEND Back Office
- Navigate to Reports from the main menu. See Inventory Report.
- Click on Stock Movement and Valuation Summary
- Set the From and To date range
- Apply filters if needed and view the results
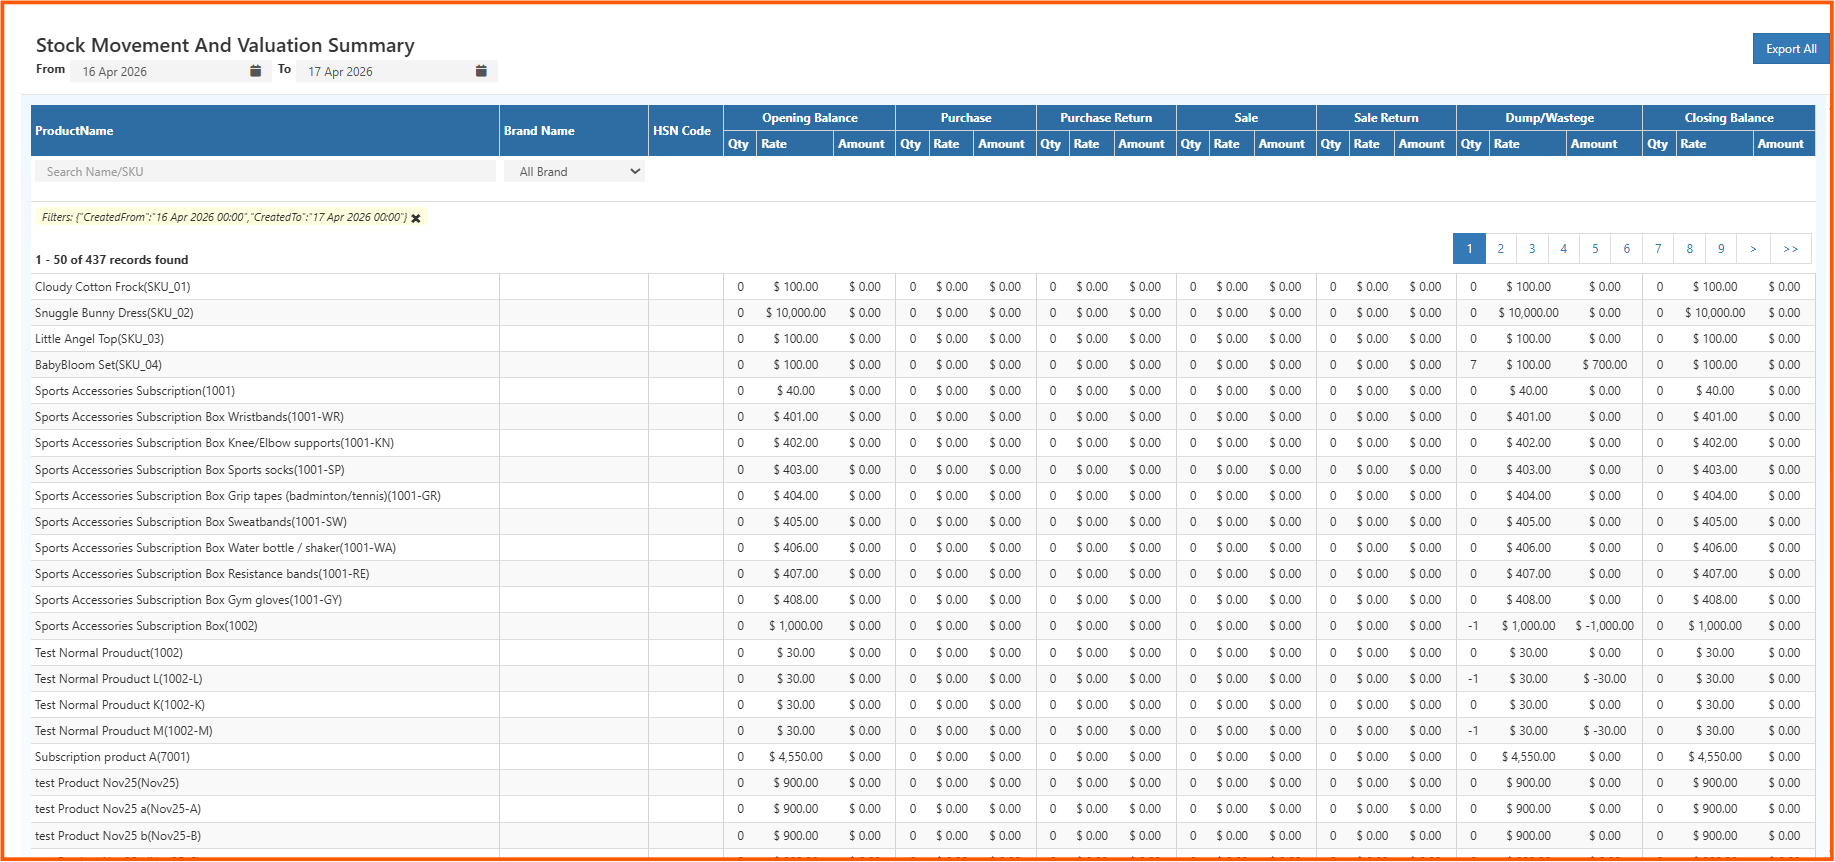
Understanding Each Column Group
Opening Balance
The stock quantity and value at the start of the selected period. This is your baseline before any movement happens.
Purchase
Units received into stock during the period, along with the rate and total purchase value.
Purchase Return
Units sent back to the supplier, with the corresponding cost value reversed.
Sale
Units sold during the period and the revenue value associated with those sales.
Sale Return
Units returned by customers, added back to stock along with their value.
Dump / Wastage
Units written off due to damage, expiry, or loss — along with the value lost.
Closing Balance
The final stock quantity and value at the end of the period, after all movement is applied.
Filters Available
Search Name / SKU Find a specific product by name or SKU code.
All Brand Filter the report to show products from a specific brand only.
Date Range (From / To) Set the period for which you want to see movement and valuation data.
Export All Download the full report using the Export All button at the top right.
How to Read the Report – Practical Insights
Opening Rate with Zero Amount The product has a rate assigned but no stock was present at the start of the period. Common for newly added products.
Negative Dump/Wastage Qty Indicates a reversal or correction of a previously recorded wastage entry.
Zero Across All Columns The product exists in the system but had no movement during the selected period. May be inactive or not yet stocked.
High Opening, Zero Purchase, Low Closing Stock is being consumed (sold or dumped) without replenishment — a reorder may be needed.
Sale Return Without Sale Customer returns were recorded in this period even though no sales appear — the original sale may have happened in a prior period.
Real-World Use Cases
Inventory Valuation Know the total value of stock at any point in time — useful for balance sheets and financial audits.
Wastage Monitoring Track how much stock is being lost to dumps or damage, and the financial impact of that loss.
Period-End Reconciliation Verify that opening stock + purchases − sales − returns − dumps = closing stock for every product.
Procurement Decisions Spot products with low closing balances and high sales to prioritize reordering.
Margin Analysis Compare purchase rate vs sale rate per product to understand gross margin at the stock level.