Product Analytics Dashboard – O2VEND eCommerce
The Product Analytics Dashboard in O2VEND helps you track product-level performance including revenue, sales quantity, conversion rate, abandoned carts, and SKU performance.
This report is essential for identifying best-selling products, improving low-performing items, and increasing overall eCommerce revenue.
📍 How to Access Product Analytics
- Login to O2VEND Back Office
- Go to Analytics
- Click on Product Analytics
- Select the required Date Range
- Review the reports
Always verify the correct date range before analyzing performance.
📊 Dashboard Sections Explained
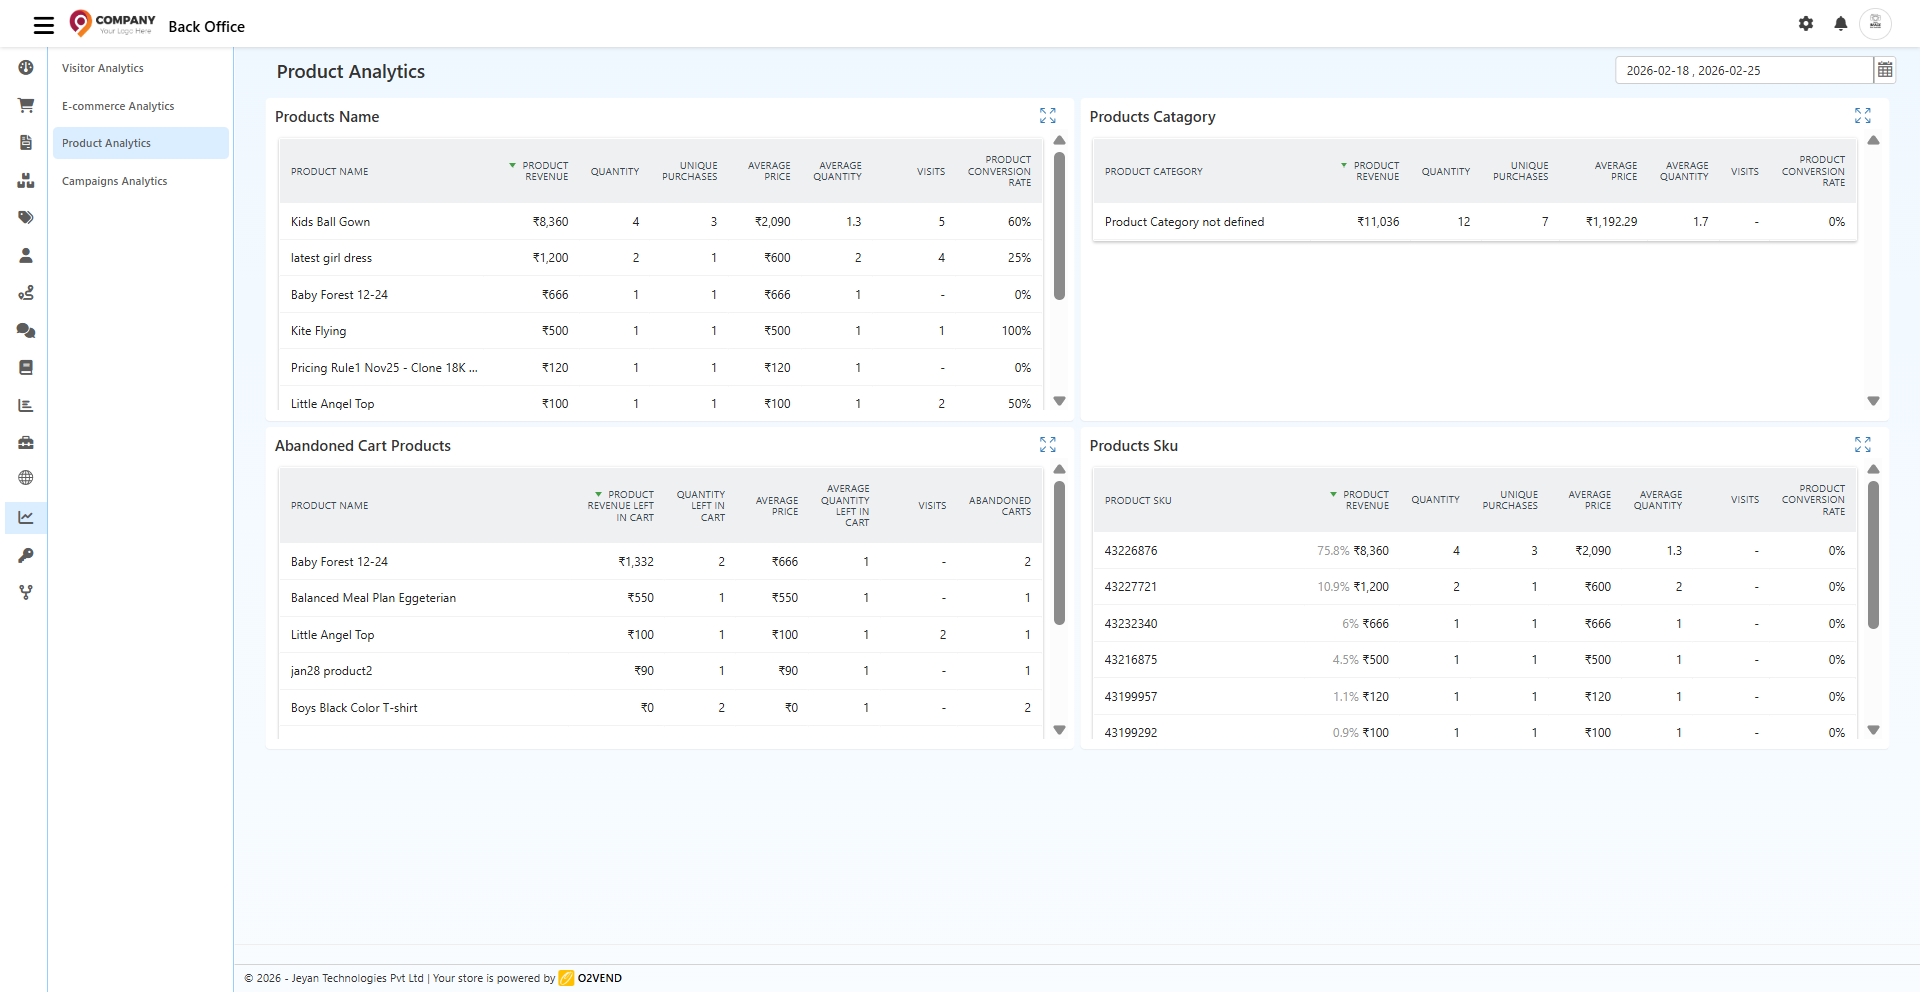
1️⃣ Products Name Report
This section shows individual product performance.
Columns Explained:
- Product Revenue – Total revenue generated
- Quantity – Total units sold
- Unique Purchases – Number of orders
- Average Price – Average selling price
- Average Quantity – Units per order
- Visits – Product page views
- Product Conversion Rate – % of visits converted to purchases
How to Use This Report
- Identify best-selling products
- Detect low-performing items
- Compare revenue contribution
- Monitor product conversion rate
- Adjust pricing strategy
👉 If product has:
- High visits + Low conversion → Improve product page
- High revenue + Low margin → Review pricing
- Low visits → Increase marketing
2️⃣ Products Category Report
Displays performance grouped by product categories.
Metrics Included:
- Category revenue
- Quantity sold
- Unique purchases
- Average price
- Average quantity
- Visits
- Conversion rate
Why It Matters
- Identify top-performing categories
- Plan category-based promotions
- Manage inventory efficiently
- Improve merchandising strategy
If you see "Product Category not defined", assign proper categories to products.
3️⃣ Abandoned Cart Products Report
Shows products added to cart but not purchased.
Includes:
- Product revenue left in cart
- Quantity left in cart
- Average quantity left
- Visits
- Abandoned cart count
How to Improve Sales Using This Report
- Identify frequently abandoned products
- Offer targeted discounts
- Improve product descriptions
- Optimize shipping charges
- Enable cart reminder notifications
Reducing cart abandonment increases revenue directly.
4️⃣ Products SKU Report
Analyzes performance at SKU (variant) level.
Shows:
- Revenue contribution percentage
- Quantity sold
- Unique purchases
- Average price
- Average quantity
- Visits
- Conversion rate
Why SKU Tracking Is Important
- Track size/color variant performance
- Identify fast-moving SKUs
- Plan stock replenishment
- Avoid overstocking slow variants
Especially useful for fashion and multi-variant products.
📈 Key Metrics to Monitor Regularly
- Product Conversion Rate
- Revenue per Product
- Category Performance
- Abandoned Cart Products
- SKU-Level Sales
Review weekly for better decision-making.
🚨 Why Data May Appear Low
Check the following:
- Correct date range selected
- Products properly categorized
- Orders successfully completed
- Website tracking enabled
- Products published and active
✅ Best Practices
✔ Review product analytics weekly
✔ Optimize low-conversion products
✔ Improve product images and descriptions
✔ Monitor abandoned cart products
✔ Adjust pricing based on data
✔ Track best-selling SKUs
✔ Remove or improve slow-moving items
The Product Analytics Dashboard in O2VEND provides complete visibility into product performance. By analyzing revenue, conversions, abandoned carts, and SKU data, you can make data-driven decisions and improve your eCommerce store profitability.
Use analytics regularly to grow smarter and faster.